New to the world of web performance? Welcome! Here's everything you need to know to master website monitoring, analytics, and diagnostics. Learn how…
There are 10 contents with this tag:
New to the world of web performance? Welcome! Here's everything you need to know to master website monitoring, analytics, and diagnostics. Learn how…
SpeedCurve | NEW: RUM attribution and subparts for Interaction to Next Paint!
In addition to advanced settings, navigation types, and page attributes, we've just released more diagnostic detail for the latest flavor in Core…
Judging by this #SpeedCurve graph comparing TTFB from last 3 months to the 3 months before, it looks like TTFB has improved lately with #Netlify, while it has degraded with #Cloudflare:
The graph is split in 2 with Jully to September 2023 on the left and October to December 2023 on the right.
I'm currently using Cloudflare in front of Netlify, but I'm not sure it's worth it anymore. 🤔
I love (some) boring #SpeedCurve graphs… 😅
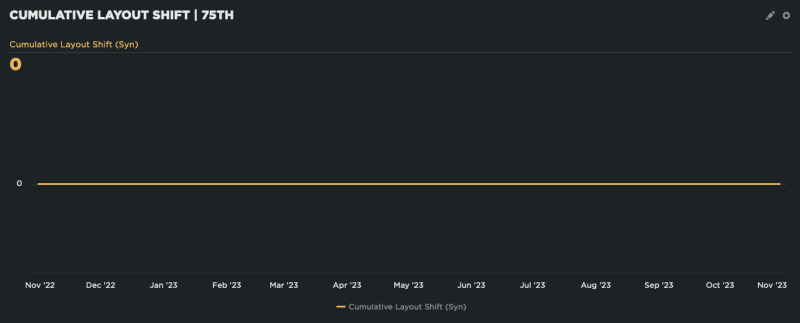
I love #SpeedCurve's simple and efficient Core Web Vitals Real User Monitoring, especially when everything is green! 🥳
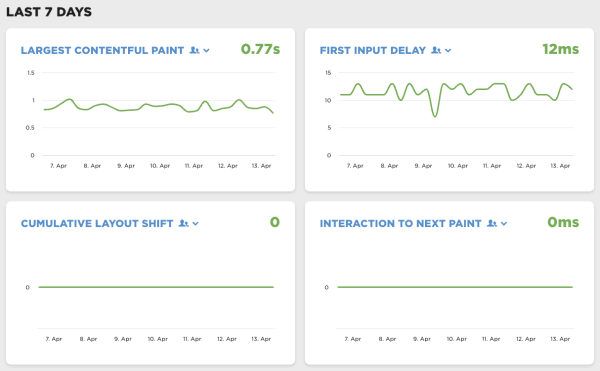
This is a real e-commerce site, with many real users everyday. After a few months of performance optimisation.

Why you need to know your site's performance poverty line (and how to find it)
The performance poverty line is the plateau at which changes to your website’s rendering metrics (such as Start Render and Largest Contentful Paint)…
This is what happens when you preload the heavy high definition pristine image instead of the responsive version… 😅
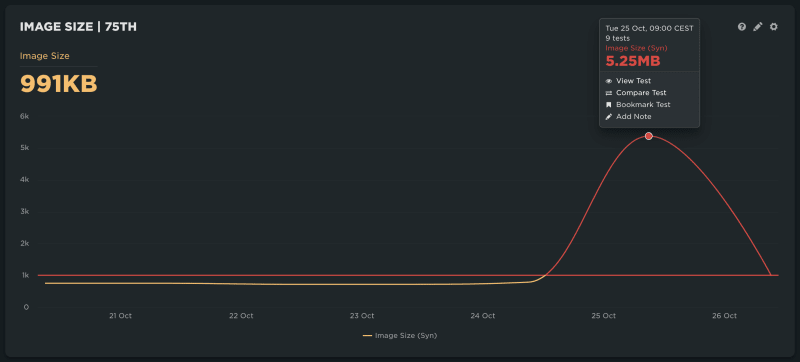
Thanks #SpeedCurve for noticing it! 🙏
I really wish I could set my own colors for graphs in #SpeedCurve, or at least they should choose different ones, this is difficult to read when colors are so close to each other. 😔

TIL:
Paint timing metrics are too optimistic. In 85-95% of cases, they are recorded before any pixels are actually rendered to the screen.
From @Joseph_Wynn's article for #SpeedCurve: https://speedcurve.com/blog/an-analysis-of-chromiums-paint-timing-metrics/
Can we monitor User Happiness on the Web with performance tools?
I really like that SpeedCurve tried to innovate with this recent "User Happiness " metric (original version ). It aggregates multiple technical metrics to decide if users visiting the page are happy or not with it. But I see several issues in this metric.
See all tags.